Join the campaign fun now!
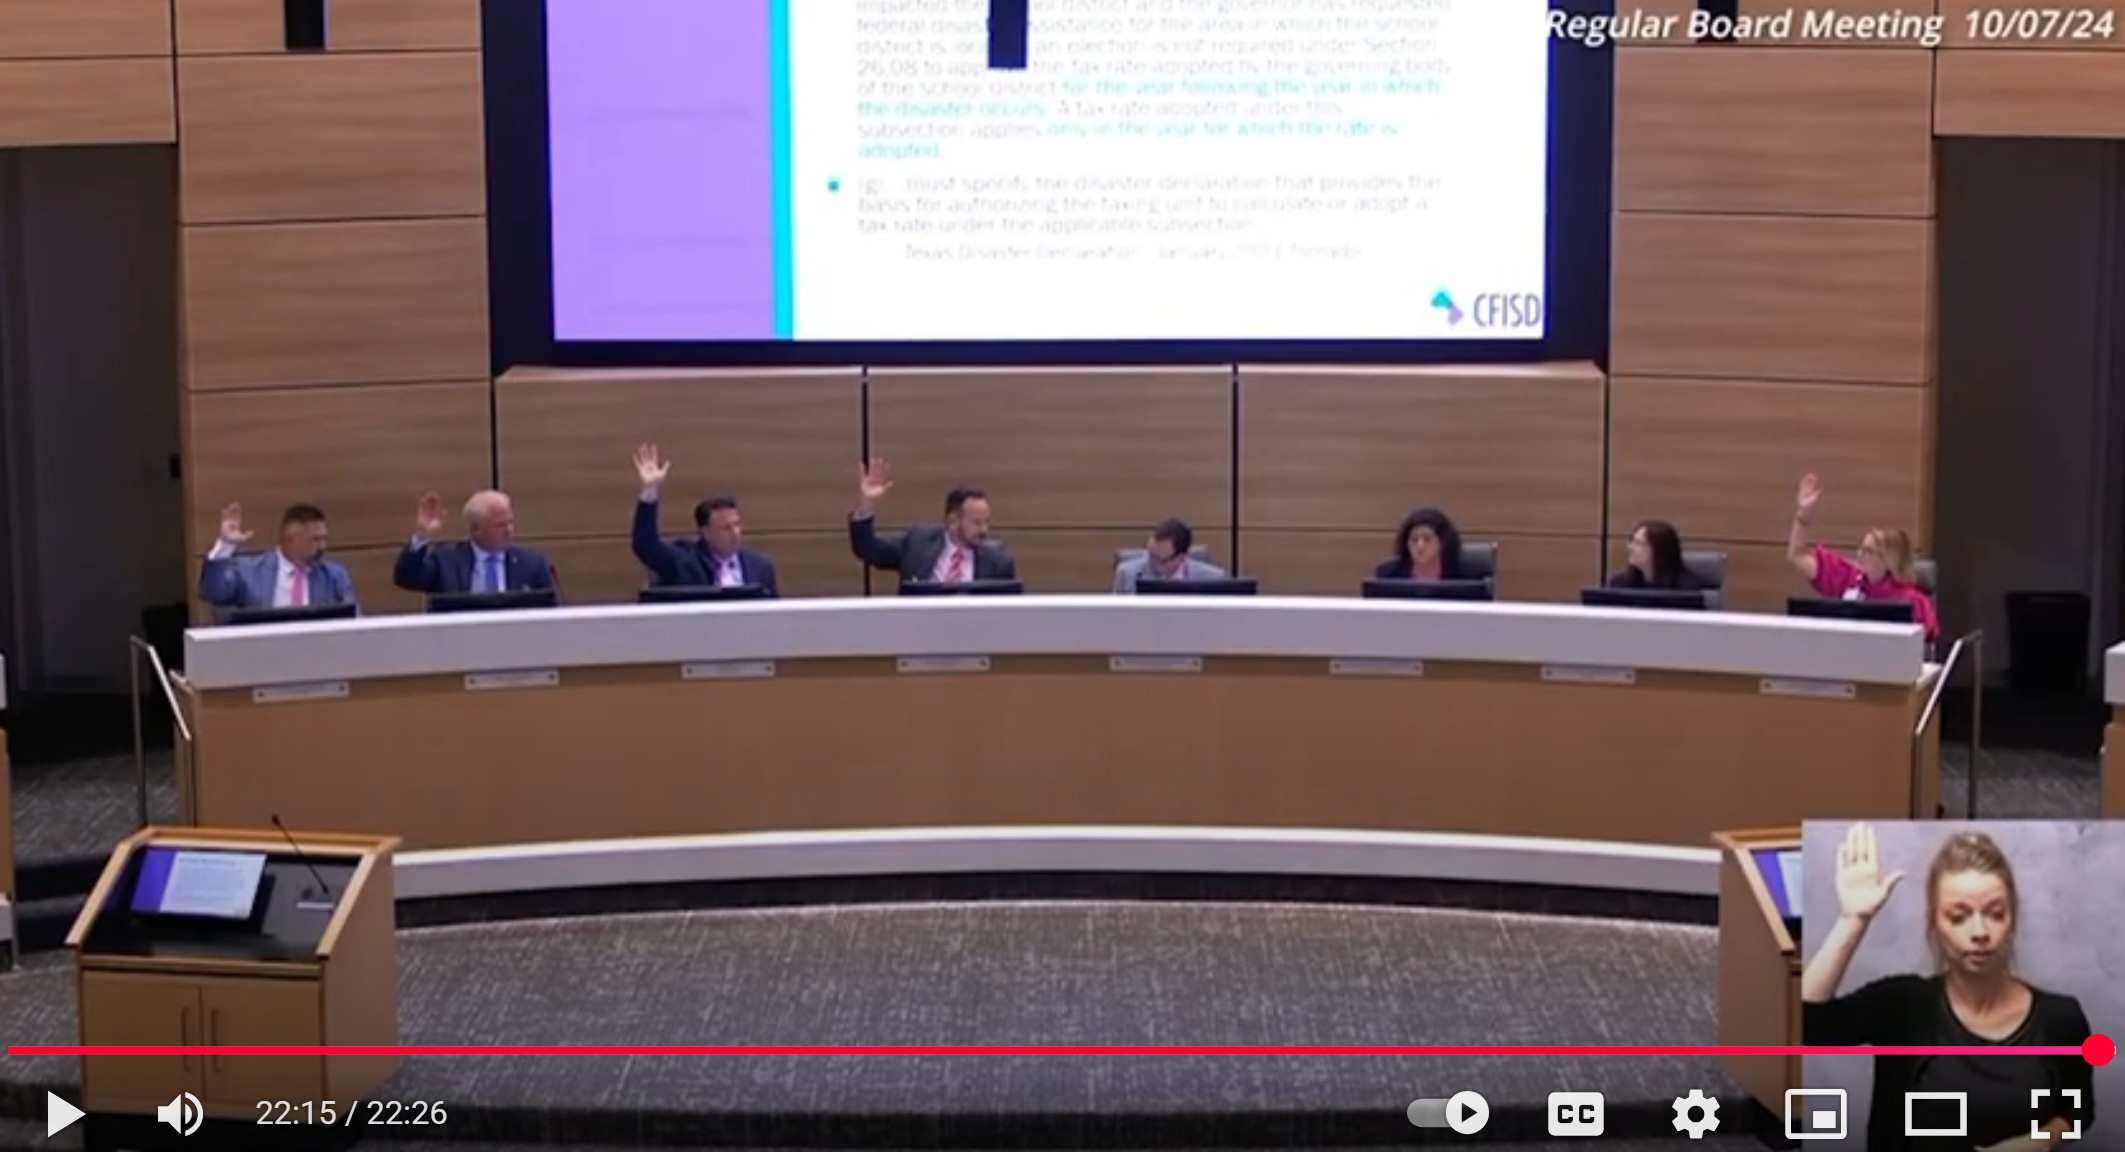
Responsible Taxpayer Stewardship Demands No Tax Increase
Before asking taxpayers to pay more, school boards must first address the growing administrative costs and stagnant or declining student performance despite soaring spending per student.
Raising property taxes without clear evidence of improved academic outcomes burdens hardworking families while perpetuating wasteful bureaucracy that fails to deliver real results.
One of the "conservative" candidates currently running for re-election, despite these concerns led the board to increasing the 2024-2025 tax rate. See below for the receipts.
Broken Promises: Tax Hike Without Accountability
Raising property taxes without clear evidence of improved academic outcomes burdens hardworking families while perpetuating wasteful bureaucracy that fails to deliver real results.
Admin-Controlled Audit Erodes Confidence
The CFISD 2024 efficiency audit by Weaver highlights critical areas for improvement in district operations. However, confidence in the findings is eroded when the auditor is selected solely by the administration, not the elected board.
One of the "conservative" candidates currently running for re-election, claims this "efficiency audit" was an exhaustive analysis to address budget deficit analysis.
Spending More, Achieving Less: Texas Education’s Costly Disconnect
Rising Costs: Analyses by the Texas Public Policy Foundation (TPPF) and other sources show that Texas's total operating expenditures grew to over $92.4 billion ($16,792 per student) in the 2022–2023 school year—a dramatic increase from prior years. Even by conservative calculations, per-student spending doubled in a decade. In contrast, claims that schools are underfunded often use only the "basic allotment" ($6,000) and ignore the full financial picture. When all revenue streams are included (state, federal, local), Texas spends more than two-thirds of other U.S. states, and funding has continually risen, not stagnated.
Academic Outcomes Lag or Decline: Despite this rising investment, performance measures such as literacy and math proficiency remain stubbornly low. While spending grows, the numbers that matter most—the number of students who can read and do math at grade level—never seem to improve. Some recent state data even show drops in reading and math achievement post-pandemic, with limited recovery in core skills despite record-level budgets.
Bureaucratic Bloat, Not Classroom Gains: Much of the spending increase has gone toward bureaucracy, regulatory compliance, and administrative growth at the Texas Education Agency (TEA), rather than directly benefiting teachers or students. Lawmakers have called the TEA a “dangerous bureaucracy, a breeding ground for wasteful spending and an ever-expanding bureaucracy that threatened the core values of education in Texas.
Mandates and Central Regulation: There is skepticism about both state (TEA) and federal oversight. Critics argue that increased central mandates—such as the controversial STAAR test or tighter state curriculum standards—have not delivered on promises of higher achievement. Top-down dictates are increasingly detached from local realities, and that local school leaders and parents are better equipped to decide educational priorities.
Calls for Local Control and School Choice: Giving parents more options—whether through charter schools, vouchers, or greater authority in local school boards—arguing that competition and decentralization would force improvements. Centralized agencies, meanwhile, are criticized for perpetuating standardized approaches that do not fit the needs of Texas’s diverse communities.
Additional Information on Concerns with Fiscal Responsibility vs. Academic Performance and Accountability
The fundamental cause of poor outcomes is that policy leaders have eroded the instructional core & designed our education system for failure.
Advantages that progressives enjoy when education becomes a bidding-war quickly turn into weaknesses when the question is who is able and willing to redesign institutions that no longer work for families, students, or taxpayers. Conservatives are uniquely positioned to do more than subsidize the status quo, to instead provide new opportunities and bust the self-serving trusts that have come to dominate the education landscape.
There’s no one-size-fits-all approach to improve our school system. We must focus on what’s best for students, not what’s most convenient for adults.
The most dishonest talking point used by opponents of school choice is that public schools are underfunded. They hide behind the complexity of the school financing system to claim schools only receive roughly $6000 per student. That number refers to what’s known as the basic allotment, but then each school receives additional money based on a formula that few people truly understand.
Texas Representative Glenn Rogers points to alarming statistics, revealing that TEA’s budget had swelled by 39% over the past decade, accompanied by a staggering increase in full-time employees.
An economic analysis shows declining returns on investment for states’ increasing education dollars.
If you want to see the problem with American education, look at a chart illustrating the comparative growth in the number of students, teachers, and district administrators in our public schools in the period between 2000 and 2019.